Google Analytics (GA) has long been the go-to analytics tool for website owners. It’s powerful, free, and packed with features. But here’s the catch: for many users, it’s also overwhelming. The interface can make finding even basic data a chore, and interpreting what you find often requires a steep learning curve.
When you add privacy concerns to the mix, it’s clear why so many website managers are exploring alternatives.
Too Much Power, Too Little Clarity
Google Analytics offers an incredible depth of information, but for most website managers, the problem isn’t the data itself—it’s how that data is presented. It is packed with features like advanced campaign tracking and detailed segmentation reports. The level of depth is impressive, but most website owners don’t need all of that.
When you first log in to GA, you’re greeted with a dashboard full of charts, graphs, and widgets. While this might be impressive, it’s not clear where to start. Do you need to look at real-time data? Traffic sources? Bounce rates? Unless you already know your way around, it’s easy to feel lost.
Finding basic information, like how many people visited your site yesterday or which pages performed best, can require navigating through multiple menus and reports. For example:
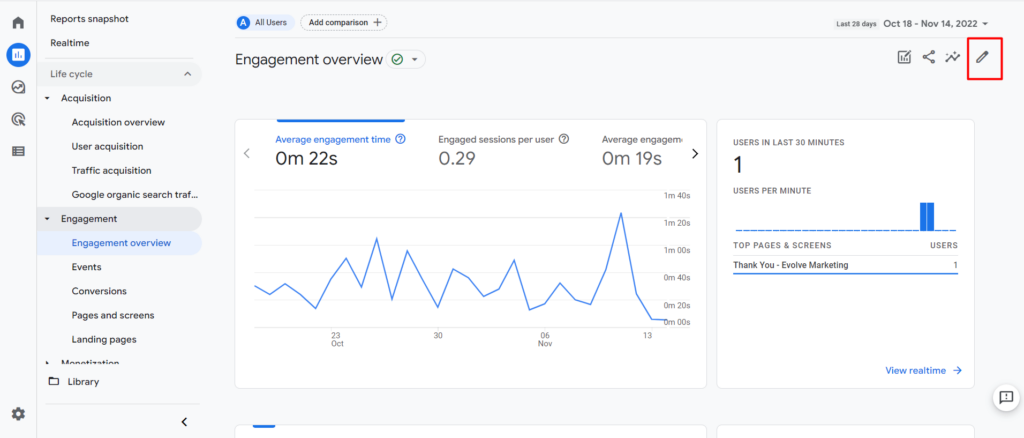
- In GA4, to check page views, you would navigate to Reports > Engagement > Pages and Screens. You’ll need to manually adjust the date range in the top-right corner of the interface.
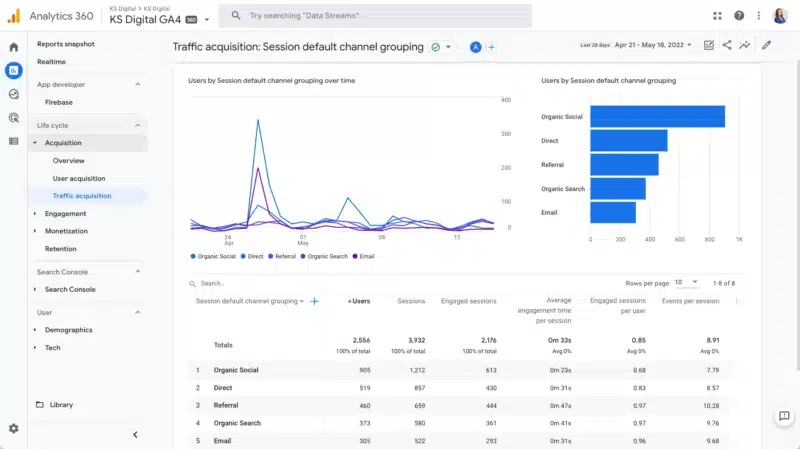
- In GA4, traffic sources are located under Reports > Acquisition > Traffic Acquisition. While the data is more visually organized than Universal Analytics’, the distinction between “User Acquisition” (first-time visitors) and “Traffic Acquisition” (all sessions) can be confusing.
This layering of data means even straightforward questions take longer to answer than they should.
Google Analytics Privacy Issues Present A Practical Problem
Google Analytics’ privacy issues are a growing concern. But what does this have to do with usability? The need to configure GA for compliance adds another layer of complexity:
- Customizing for Privacy: Anonymizing IP addresses or configuring cookie consent banners requires manual setup. This is time-consuming and frustrating just to tell people you’re using Google Analytics.
- Compromising Trust: Privacy-conscious visitors may feel uneasy knowing their data is tracked so extensively. This can harm your site’s reputation, especially when simpler, privacy-friendly alternatives are available.
Privacy Focused Alternatives Are Metric Focused Alternatives Too
A new generation of analytics tools has emerged in response to website owners’ privacy and usability complaints. These Google Analytics alternatives prioritize simplicity, privacy, and speed.
- Lightweight Scripts: These alternatives don’t slow down your site with bulky scripts
- Intuitive Interfaces: Clean, minimalist dashboards that show key metrics without confusion.
- Privacy Compliance: No user tracking, no invasive cookies, and no banners.
- Focused Insights: Basic but actionable data—think traffic sources, visitor numbers, and popular pages—presented in a way that’s easy to digest.
They go out of their way to show data differently.
For most website owners, the goal isn’t to dive deep into attribution models or multi-channel funnels. It’s to answer questions like:
- How many people visited my site?
- Which pages are driving the most traffic?
- Where are my visitors coming from?
Real World Data Presentation
Let’s look at some examples of how three different Google Analytics alternatives present information and compare how you’d get the same from GA.
Visitor Data
- Google Analytics: To check yesterday’s total visitors, you navigate to Reports > Acquisition > Traffic Acquisition or Reports > Engagement > Overview. Then, determine whether you want to see “active users” or “total users.”
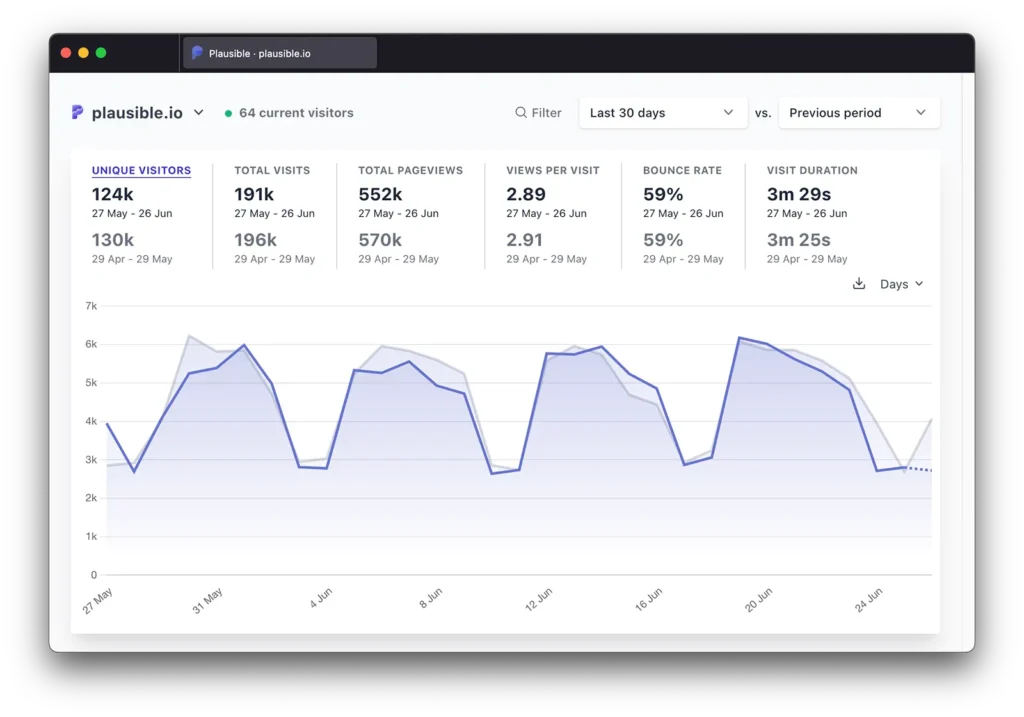
- Plausible: The main dashboard shows total visitors for any date range you choose, no additional clicks needed.
Traffic Sources
- Google Analytics: Traffic sources are located under Reports > Acquisition > Traffic Acquisition, where you’ll find categories like “Session Default Channel Grouping.”
- Fathom: Traffic sources are displayed as simple categories—e.g., “Google,” “Twitter,” or “Email”—so you know immediately where your audience is coming from. Note the ability to see your data in percentages as well as counts.

Top Pages
- Google Analytics: To find your top-performing pages, go to Reports > Engagement > Pages and Screens. This view shows metrics like “views” and “engagement time.”
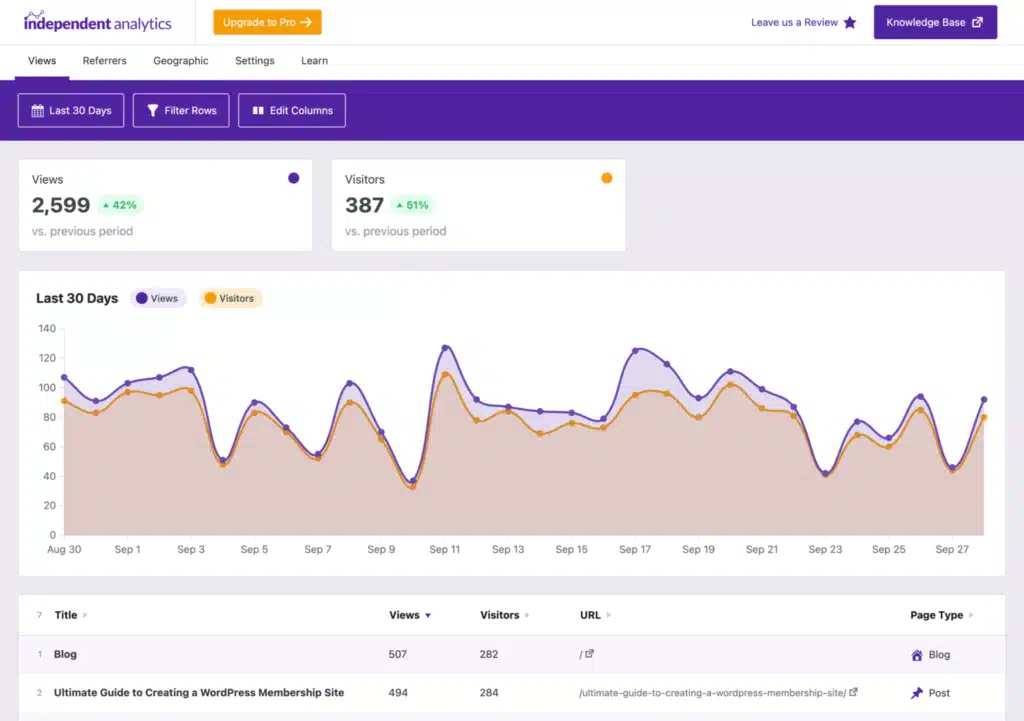
- Independent Analytics: Shows top pages with visitor counts in a clean, scrollable list, designed specifically for WordPress users.
Should You Consider Switching?
If your website relies heavily on detailed metrics, advanced tracking, or ad campaign optimization, Google Analytics may still be the right choice. But for most website owners a simpler tool is often more effective.
Privacy-focused tools like Fathom, Plausible, and Independent Analytics are changing the game. Whether you’re managing a brochure site, trying to grow an audience, or just plain tired of digging through Google Analytics, there’s no reason to settle for a tool that isn’t really helping you. You have options now, so explore them!